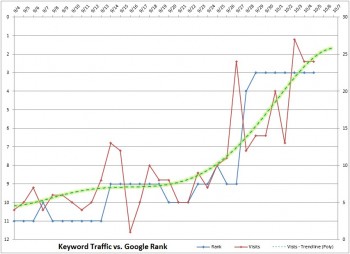
As an SEO company, it is important to keep your clients up to date on their rankings and organic search traffic volumes. I often use a graph created via Microsoft Excel to show our SEO clients the progress we have made in website keyword rank and the impact that the change in rank has had on the amount website visitors via organic searches in Google.
A report such as this could help to encourage your client to continue paying for search engine optimization efforts or perhaps increase their Internet marketing budget to allow link-building and optimization of more keywords.
Below is the basic process that I use to produce the graph that I include in the written report on traffic volume vs. keyword rank for an individual keyword using MS Excel.
- Use the ‘old’ Google Analytics to export the daily traffic for a single keyword
- Go to Traffic Sources | Keywords | Show: non-paid
- Click on the desired keyword from the list to isolate visit data for only that keyword
- Click ‘Export | CVS’ from menu above the traffic graph
- Use historical ranking data exported from the client’s Authority Labs account
- Merge the Authority Labs ranking data into the Google Analytics spreadsheet in a new column called ‘Rank’
- Insert a Line Chart with all data selected
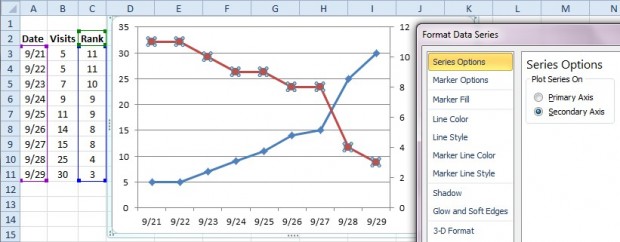
- Format the ‘rank’ data series so that it is appears on a secondary axis
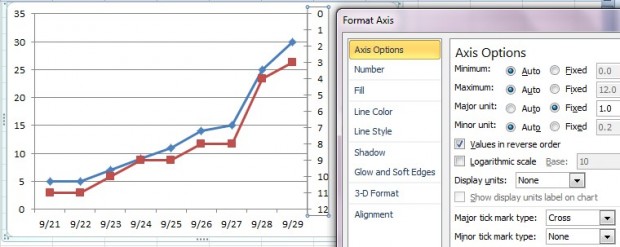
- Format the ‘rank’ axis by checking the box that says ‘Values in reverse order’
- Save the graph as an image or screen shot it to email it to the client.
GA Data
 Google Analytics Export Data |
Authority Labs Data
 Authority Labs Export Data |
Format the Secondary Axis:
Reverse the Order of the Values of the Secondary Axis:


