What do these numbers mean?
Interpreting Google Analytics
The metrics reported by Google Analytics provide valuable information about how users interact with your website. This guide can help you interpret the data and apply it to your marketing and SEO campaigns.
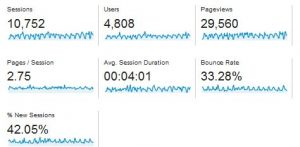
Sessions
Google defines a session as “the period of time a user is actively engaged” on a site. Sessions typically expire after 30 minutes, but the amount of time can be adjusted as desired. High numbers of new sessions means more new traffic. Low numbers indicate repeat visitors and a potentially higher level of engagement.
Visits and Page Views
Visits specify the number of people who come to your site. Every visit is counted, but only visits from new users are listed as unique. The “pageviews” metric shows how many visits a particular page on your site has received. Taken together, viewing data helps determine the popularity of your site.
Pages Per Visit
This number represents the ratio of page views to visits, or the average number of pages that visitors look at when they’re on your site. It shows the extent to which people are browsing and how well your content is holding their interest.
Time on Page
The amount of time people spend on particular pages can mean different things depending on what the pages contain. Longer times on content-heavy pages indicates that people are reading what you’ve written. Short times on product pages may mean that visitors aren’t finding what they’re looking for.
Dollar Index
A high dollar index means that a page is closely associated with conversions. This metric can help you determine which pages on your site guide users to purchase products or sign up for services. It’s a good way to monitor if targeted landing pages are working and to determine what types of site content are most influential.
Average Session Duration
The length of time that visitors typically spend on your site is a direct indicator of engagement. A low average may mean that potential customers don’t feel that your site provides the solutions they want in the form of products or information and that they’re leaving to look elsewhere.
Bounce Rate
Google records a bounce every time someone visits your site, loads one page and leaves. However, the same user may return later in a new session and spend more time on your site. Bounce rate is best for determining which pages turn people away so that you can take steps to improve the content. Have a High Bounce Rate? Here’s How to Fix It.
Entrance and Exit Rate
Entrance rate indicates pages that are the first viewed by visitors. Exit is the opposite metric, showing the last pages viewed. Along with the bounce rate, these two numbers are useful for figuring out what content draws people to your site and what makes them leave.
Use the knowledge gained from these metrics to make your site more prominent in search results and more engaging to visitors. Track how improvements perform, and continue to apply changes as necessary to drive more traffic.
Call us at Orion to see what we can do for your business. Our Internet Marketing department can help you with your Google Analytics set up, and get you the insights to improve sales, conversions, and profits!